A New Dimension in Analyzing In-Store Suspicious Behaviors
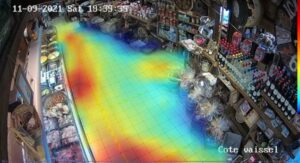
Adopting suspicious gesture heatmaps allows stores to transform complex data into clear, actionable visual information. These visualizations identify “hot” zones – i.e., those where suspicious gestures or at-risk behaviors are frequently detected – and “cold” zones, less affected by these incidents. This type of map is not just for identifying areas to monitor; it provides a comprehensive and strategic understanding of in-store dynamics.
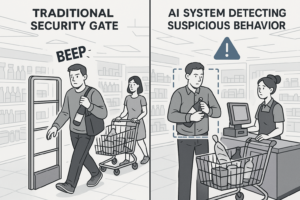
By leveraging these maps, store managers can adapt the positioning of security teams, adjust customer paths, or even reorganize aisles to reduce blind spots. This represents a major advancement compared to traditional video surveillance, which is often reactive rather than proactive.
Integrating risk zone visualization into the prevention strategy therefore allows for better operational management, more efficient allocation of human resources, and increased anticipation of incidents.
Optimizing Store Layout for Smart Prevention
Thanks to these heatmaps, retailers can revise their sales floor layout based on concrete data. For example, if an end-of-aisle area is consistently marked in red, it may signal a lack of visibility or being too close to the exit. Teams can then reposition sensitive products or reinforce deterrent signage.
This data-driven approach enables a subtler yet more effective prevention. Customers thus enjoy a seamless, secure, and more pleasant space, while theft-related losses decrease.
By combining these visuals with real-time behavioral analysis like that offered by Oxania, it is possible to anticipate risks without burdening daily operations.
Data That Speaks for Itself to Guide Managerial Decisions
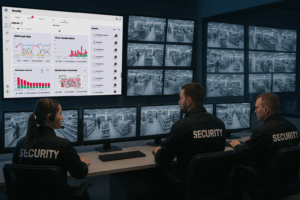
The risk zone map becomes a true decision-making tool. By providing an instant and evolving overview of in-store behaviors, it helps site directors, security managers, and audit teams make concrete and measurable decisions.
For example, it can justify adding cameras in certain areas, prompt specific training for employees, or guide more suitable patrol schedules. Beyond the security aspect, these maps also impact merchandising: they reveal high-traffic areas that can be commercially leveraged or, conversely, decongested for a better customer experience.
This visualization is therefore much more than a prevention tool: it is a lever for overall optimization that supports both economic performance and customer satisfaction.
Oxania: Making Data Useful, Accessible, and Actionable
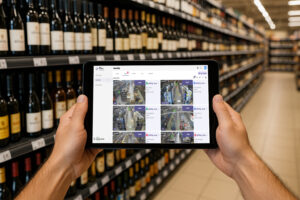
Oxania offers an advanced suspicious gesture detection technology coupled with intuitive visualizations like this one. The system transforms video streams into actionable, continuously updated heatmaps, accessible from a clear interface designed for the needs of stores.
This ability to provide a reliable and dynamic overview gives on-the-ground teams a strategic advantage: they no longer just monitor; they act in a targeted, measurable, and proactive way. Integration is seamless, results are immediate, and the added value is felt at all levels: fewer thefts, greater visibility, and better organization.
In short, a solution that converts data into decisions, and decisions into results.