Unknown shrinkage calculator
Enter your annual revenue and your unknown shrinkage rate. The calculator shows your annual shrinkage, as an amount and in days of revenue, and what a reduction of 0.1, 0.25 or 0.5 points would represent. The calculation runs in your browser, nothing is sent.
Indicative estimate, calculated from your figures alone. It does not predict the results achieved in store, which depend on your floor area, your organization and your teams.
Discuss your figures with usYour estimated unknown shrinkage
37 500 € per year
The equivalent of 5,5 days of revenue.
If your shrinkage rate dropped by…
Losses avoided each year, if the reduction applied to the full year. Full bar: your current annual shrinkage.
See the calculation details
| Line | Calculation | Result |
|---|---|---|
| Estimated annual shrinkage | 2 500 000 € × 1,5 % | 37 500 € |
| 0.1 point reduction | €2,500,000 × 0.1% | €2,500beyond your current rate |
| 0.25-point reduction | €2,500,000 × 0.25% | €6,250beyond your current rate |
| 0.5-point reduction | €2,500,000 × 0.5% | €12,500beyond your current rate |
| Equivalent in days of revenue | 1.5% × 365 days | 5.5 days |
Estimated shrinkage: €37,500 per year.
How to calculate your unknown shrinkage
Unknown shrinkage is the gap between the stock your records predict and the stock actually counted at inventory, once the losses you can explain have been removed: breakage, expired products, identified errors. It is calculated in two steps.
1. Unknown shrinkage, in value
(Opening stock + purchases for the period) − (closing stock counted at inventory + sales for the period)
2. The unknown shrinkage rate
Unknown shrinkage ÷ revenue for the same period × 100
The calculator starts from the rate, which is easier to find in an inventory report, and works backwards: annual shrinkage = annual revenue × rate. The equivalent in days of revenue is rate × 365.
Worked example
A store generates €3,000,000 in revenue over the year. Its latest inventory shows €36,000 of unknown shrinkage.
- Unknown shrinkage rate: 36,000 ÷ 3,000,000 × 100 = 1.2%.
- Equivalent in days of revenue: 1.2% × 365 = 4.4 days.
- If this rate fell by 0.25 points, to 0.95%, shrinkage would drop to €28,500 per year, which is €7,500 less.
These amounts remain an order of magnitude: they assume stable revenue and a reduction sustained throughout the year.
How to read the result
- Compare your rate with itself, from one inventory to the next, before comparing it with a market average: studies do not all measure the same thing, as shown by our key shoplifting figures.
- An overall rate hides disparities. A few product families, a few zones and a few time slots often account for most of the losses. Our guide to understanding, calculating and reducing unknown shrinkage details the method.
- A 0.1-point reduction seems small. On €2,500,000 of revenue, it nevertheless represents €2,500 per year.
Frequently asked questions
Where can I find my unknown shrinkage rate?
In the report of your latest inventory. You can also calculate it: unknown shrinkage for the period, divided by revenue for the same period, multiplied by 100.
What does a 0.1-point reduction mean?
The rate goes, for example, from 1.5% to 1.4% of revenue. We speak of points rather than percentages: on a rate of 1.5%, a 0.1-point reduction cuts shrinkage by about 7%.
Are my figures saved?
No. The calculation is done entirely in your browser: nothing is sent or stored.
How can I reduce my unknown shrinkage?
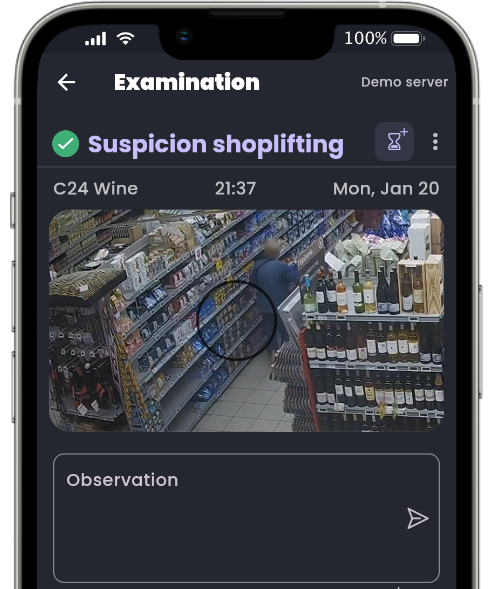
By first knowing where and when it occurs: product families, zones, time slots. Cycle counting, variance analysis and video analysis all help. Oxania analyses at-risk gestures on your existing cameras and sends a video alert to your team in under 10 seconds: the technology detects, the team decides what happens next. See how the analysis works.
Find out where your shrinkage occurs
Our experts show you, on your existing cameras, where and when at-risk gestures are concentrated.
Response within 48 hours