At-risk gesture heatmaps: a new way to read in-store activity
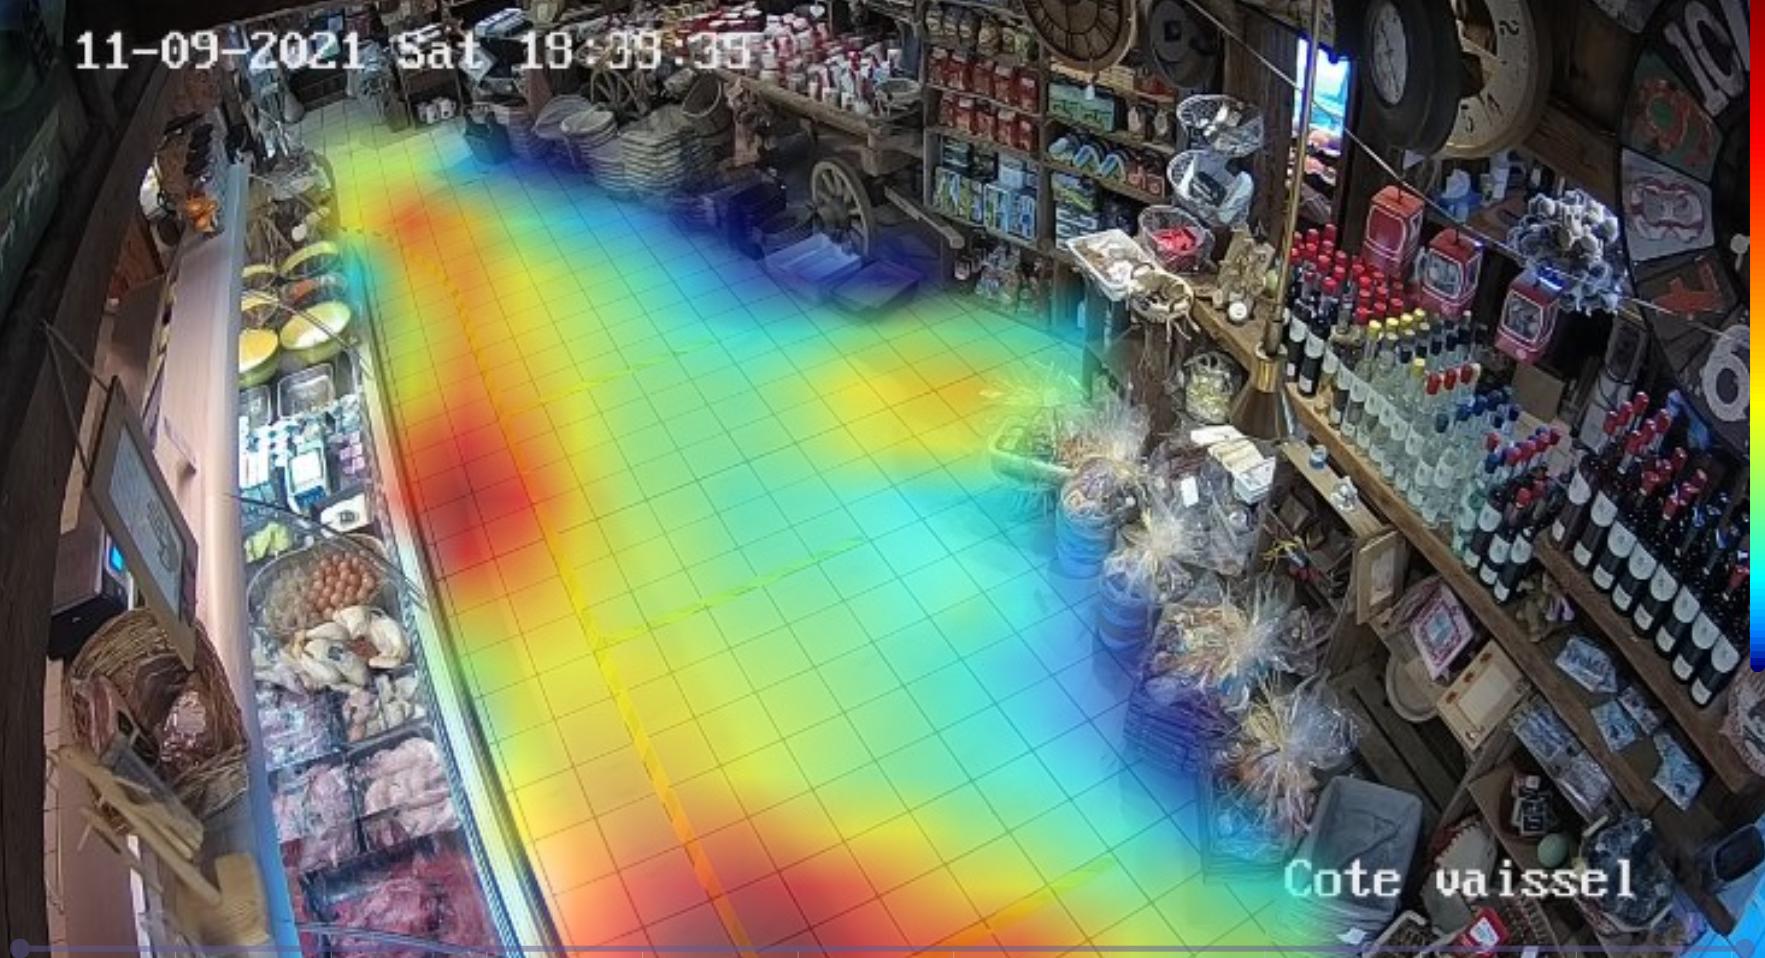
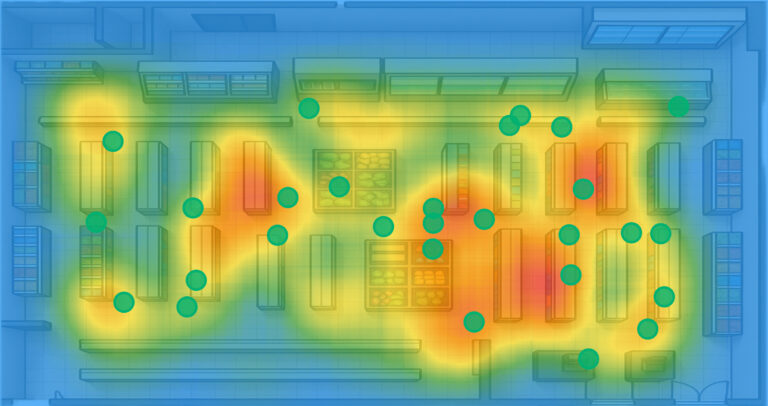
Adopting at-risk gesture heatmaps allows stores to turn complex data into clear, actionable visual insights. These visualizations identify the "hot" zones, meaning those where at-risk gestures are frequently detected, and the "cold" zones, which are less affected by such incidents. This type of map is not only used to spot the zones to cover as a priority; it offers a global, strategic understanding of in-store dynamics. In a context where retail theft incidents rose by 93% between 2019 and 2023 according to the NRF, having such anticipation tools has become indispensable.
By using these maps, store managers can adjust the positioning of security teams, tweak customer journeys, and even reorganize aisles to reduce blind spots. This is a major step forward compared with conventional video surveillance, which is often reactive rather than proactive.
Integrating the visualization of risk zones into the prevention strategy therefore enables better operational management, more efficient allocation of human resources, and greater anticipation of incidents.
Optimizing store layout through risk zone mapping
Thanks to these heatmaps, retail chains can review the layout of their sales floor based on concrete data. For example, if an area at the end of an aisle is consistently marked in red, this may point to a lack of visibility or an area that is too close to the exit. Teams can then reposition sensitive products or reinforce deterrent signage.
This data-driven approach enables prevention that is gentler yet more effective. Customers benefit from a smooth, secure and more pleasant space, while losses due to theft decrease. To explore this topic further, at-risk gesture detection software is an essential complement to this visual approach.
By combining these heatmaps with complementary data (people counting, real-time gesture analysis), it is possible to anticipate risks without burdening daily operations. This is notably the approach taken by Oxania, whose people counting and heatmap features provide a complete view of activity at the point of sale.
Guiding management decisions through data visualization
The risk zone map becomes a true decision-making tool. By providing an instant, evolving overview of in-store activity, it helps store directors, security managers and audit teams make concrete, measurable decisions. The work of the Loss Prevention Research Council (LPRC) also confirms the growing interest in these analytical approaches to retail loss prevention.
For example, it can justify adding cameras in certain zones, motivate specific training for employees, or help set more suitable patrol schedules. To identify the most relevant metrics, it is advisable to rely on key performance indicators suited to shrinkage. Beyond security, these maps also have an impact on commercial organization: they reveal high-traffic zones that can be commercially leveraged or, on the contrary, decongested for a better customer experience.
Research conducted by the ECR Retail Loss Group illustrates the growing importance of this collaborative approach between field data and commercial strategy to reduce losses. This visualization is therefore much more than a prevention tool: it is a lever for overall optimization, supporting both economic performance and customer satisfaction.
From data to action: turning alerts into concrete decisions
The true value of at-risk gesture mapping lies in its ability to trigger concrete actions. Visualizations, however precise, only have an impact if they lead to operational decisions: repositioning a staff member, rearranging an aisle or adjusting a prevention policy.
This is why it is essential that humans remain the sole decision-makers. The technology provides the information (an alert, a red zone on the map), but it is the store manager or the security team who decides what action to take. This philosophy, championed by players such as Oxania, ensures a responsible and proportionate use of the data collected.
By relying on the combination of intelligent security and customer insights, retail chains can convert their data flows into performance levers: fewer thefts, a better understanding of customer traffic and more efficient day-to-day organization. In short, at-risk gesture mapping is not limited to a security tool: it is a genuine strategic management instrument that turns data into results.