Shrinkage is a critical challenge for retailers today, directly impacting their profitability and operational efficiency. With advancements in intelligent detection, stores now have access to precise and actionable data, transforming security into a true performance driver.
Among these solutions, the key performance indicators (KPIs) play a central role. They allow for detailed analysis of activity, detection of anomalies, and optimization of resource allocation.
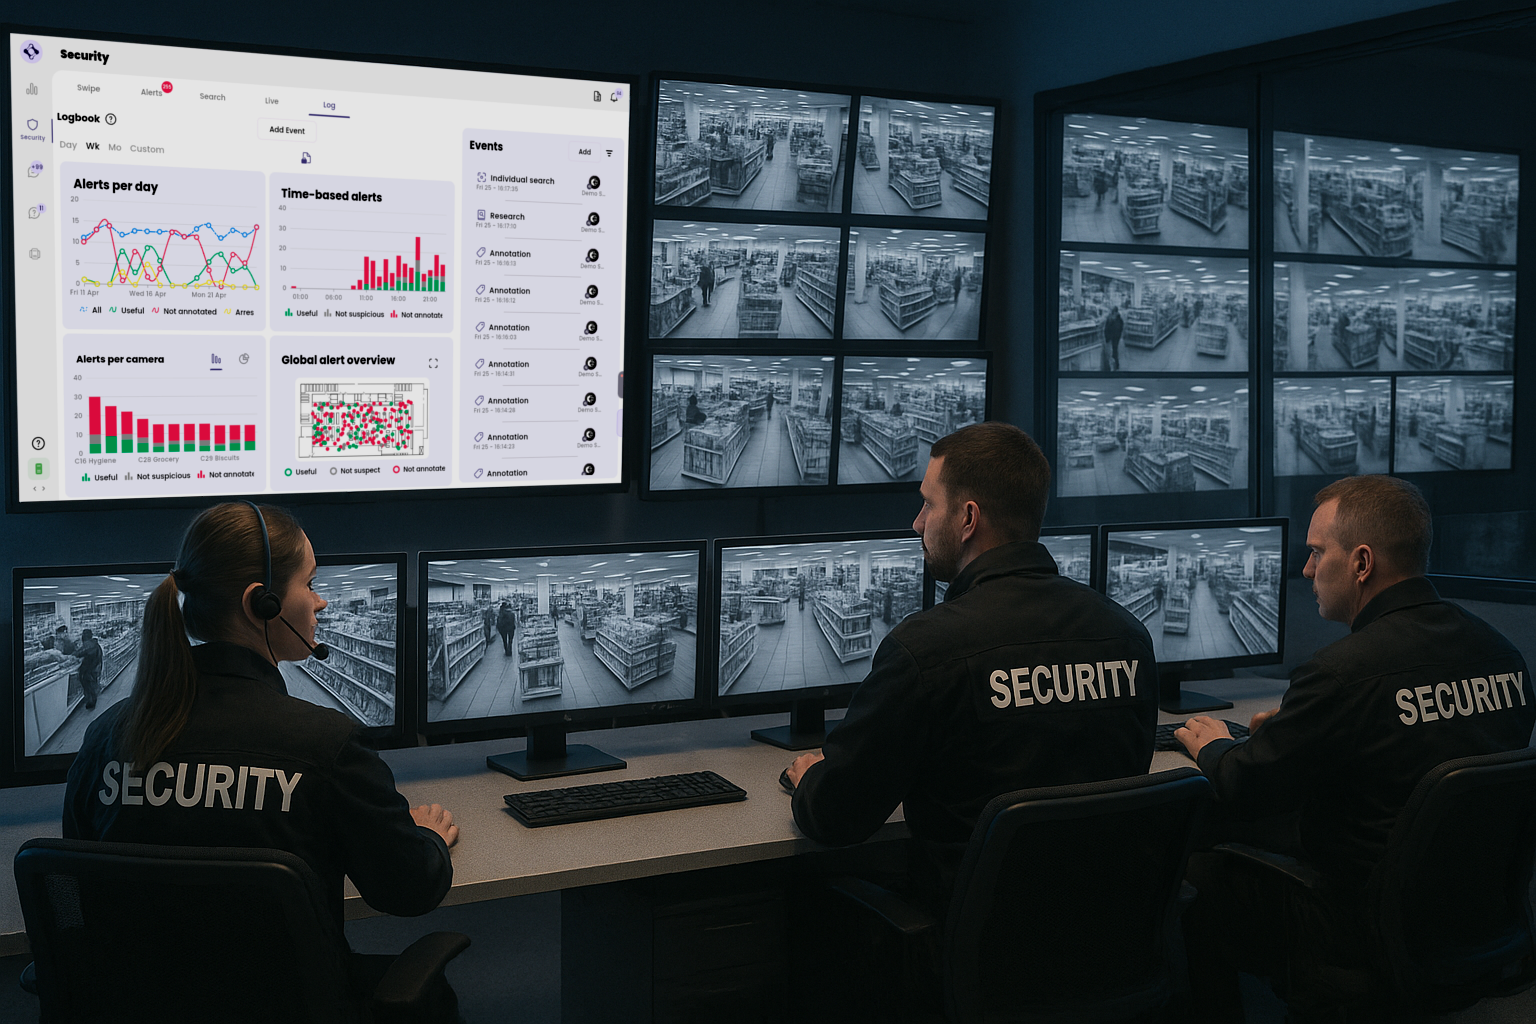
When used effectively, KPIs—such as the number of alerts per day, per hour, or per camera, comprehensive alert maps, heatmaps, and response times—provide a clear view of vulnerabilities and actionable insights to effectively reduce shrinkage, while preserving the customer experience.
📈 Dynamic Alert Tracking: by Day and by Hour
Tracking the number of alerts generated daily and their hourly distribution provides security teams with a detailed understanding of the store's internal dynamics. A spike in alerts at the end of the day or during specific time slots can indicate increased vulnerability due to reduced vigilance or higher foot traffic.
By analyzing this data, managers can adjust their strategies: strengthening physical presence at critical times, optimizing agent rotations, or reorganizing teams to cover sensitive periods. Observation over several weeks also makes it possible to detect recurring trends, anticipate activity peaks, and plan human resources accordingly.
Thus, the daily and hourly alerts KPI becomes a true strategic tool, driving continuous improvement in shrinkage prevention.
📷 Per-Camera Performance Analysis
Cameras play a crucial role in any surveillance system, but not all areas of a store present the same level of risk. This is where the analysis of suspicious gestures by Oxania .
By identifying the cameras that generate the most useful alerts, security managers can quickly pinpoint high-priority areas to monitor. A camera with a high number of alerts can indicate a sector prone to theft attempts, an area with poor visibility for staff, or a flaw in the store's layout.
Conversely, a complete lack of alerts can also reveal a blind spot in the camera network's coverage. Thanks to this analysis, managers can reposition certain equipment, add extra cameras, or reinforce human resources in strategic locations, all while optimizing existing investments.
🛒 Comprehensive Alert Map: An Intelligent Overview
The comprehensive alert map is a real asset for in-store security management. By overlaying alert points on a detailed map of the premises, managers get an immediate overview.
This visual representation helps identify "red zones" that require increased vigilance, but also to understand the dynamics of suspicious gestures associated with shoplifting. A concentration of alerts near an exit, a sensitive aisle, or a low-visibility area can lead to rethinking the store layout, repositioning staff, or adjusting certain procedures.
The comprehensive map also facilitates internal communication by making information clear, visual, and accessible to everyone. Thanks to this incident heatmap, decisions become faster, more collaborative, and more effective, reducing shrinkage and enhancing the flow of daily operations.
🔥 Heatmap: Visualizing Activity to Better Anticipate
The hot zone heatmap is a valuable tool for further refining the strategy to combat shrinkage. It provides a visualization of the areas where activity is most intense, based on movements detected by cameras and the alerts generated.
This type of analysis allows you to go beyond simple incident management to anticipate risks: for example, by noticing that a high-traffic area is poorly monitored, it becomes possible to reinforce the human or technological presence there. Similarly, overly isolated areas can be redesigned with a new layout to limit opportunities for theft.
Using heatmaps thus helps build a safer, smoother, and more pleasant shopping environment for customers, by aligning commercial objectives with security requirements.
⏱️ Response Time and Team Streamlining
The response time to alerts is a fundamental indicator for measuring the operational efficiency of security teams. A short response time not only means better protection against incidents but also a reassuring presence for customers and a general climate of security in the store.
By precisely tracking these times, it is possible to identify bottlenecks in the communication chain or deficiencies in task distribution. Furthermore, by analyzing average response times, managers can streamline agent deployment: avoiding redundancies, better covering peak traffic hours, and allocating resources more strategically.
This also makes it possible to optimize costs without compromising the quality of the system, by investing where the need is real, while boosting the motivation and engagement of teams on the ground.
🚀 Oxania: A Trusted Ally for Intelligent Security
In this demanding environment, partnering with an innovative provider is more essential than ever. Thanks to its AI-based intelligent detection solutions, Oxania enables retailers to transform security management into a true driver of overall performance.
By leveraging clear, visual, and operationally-connected KPIs, Oxania helps retailers prevent incidents, optimize their teams, and improve the customer experience. Our approach is part of a dynamic of continuous improvement, with tools designed to be simple to use while offering in-depth analysis.
By choosing Oxania, retailers enhance their operational efficiency, reduce shrinkage, and lay the foundation for sustainable and controlled growth.


