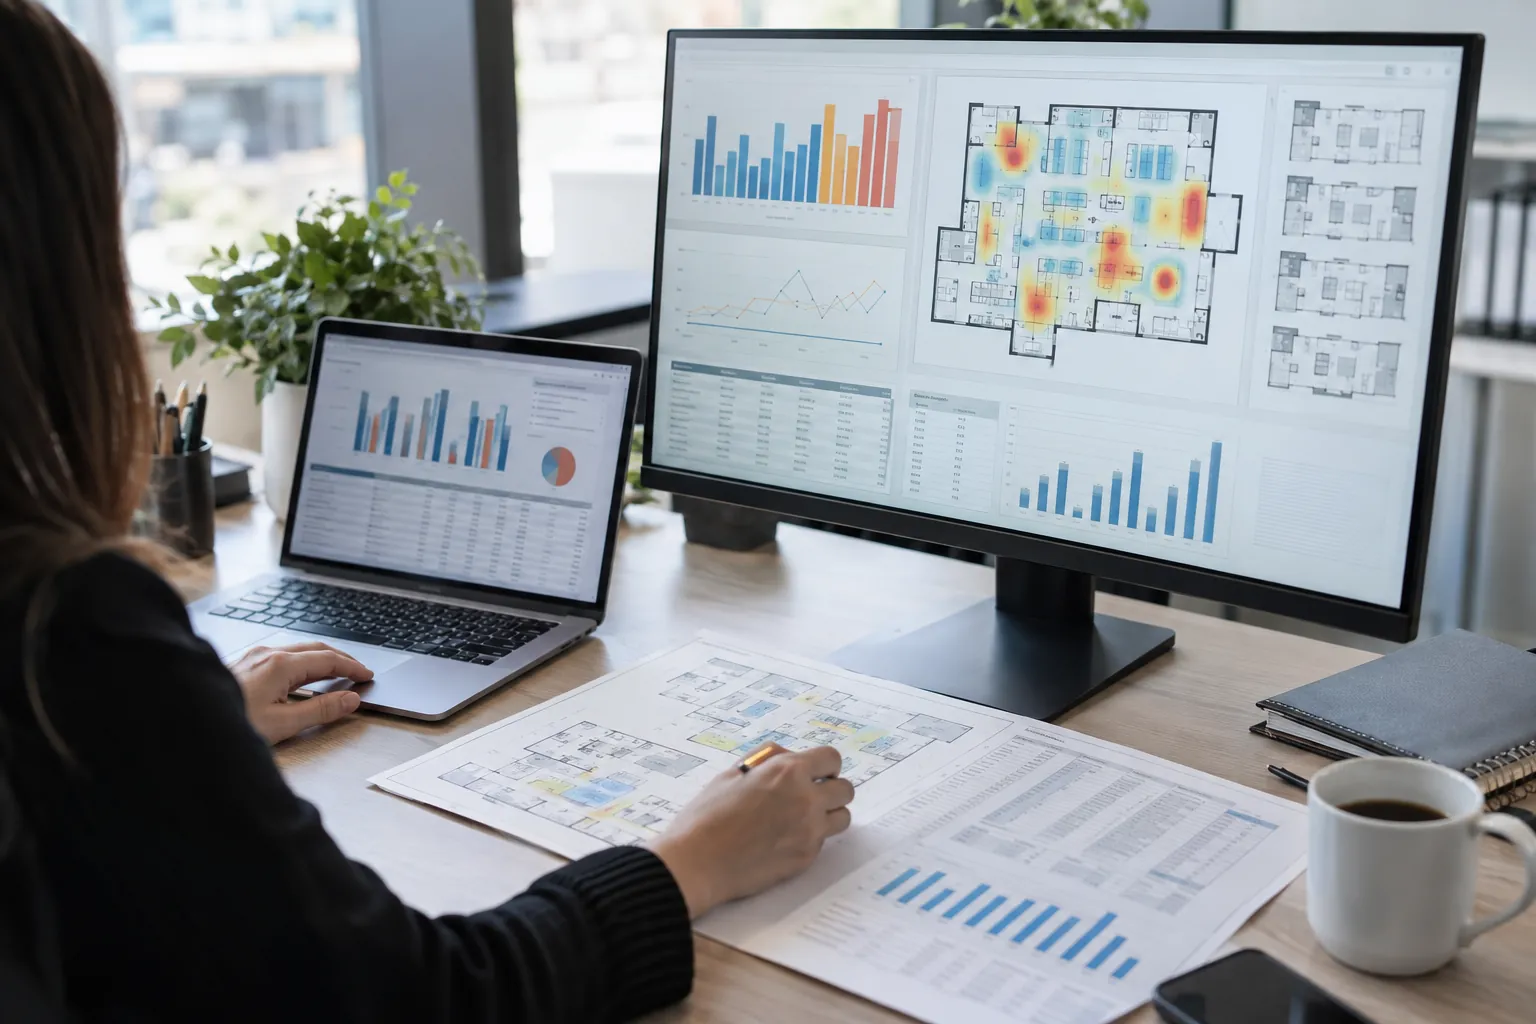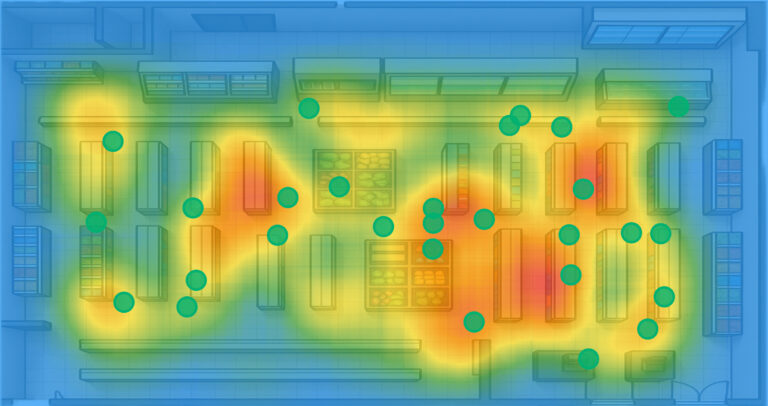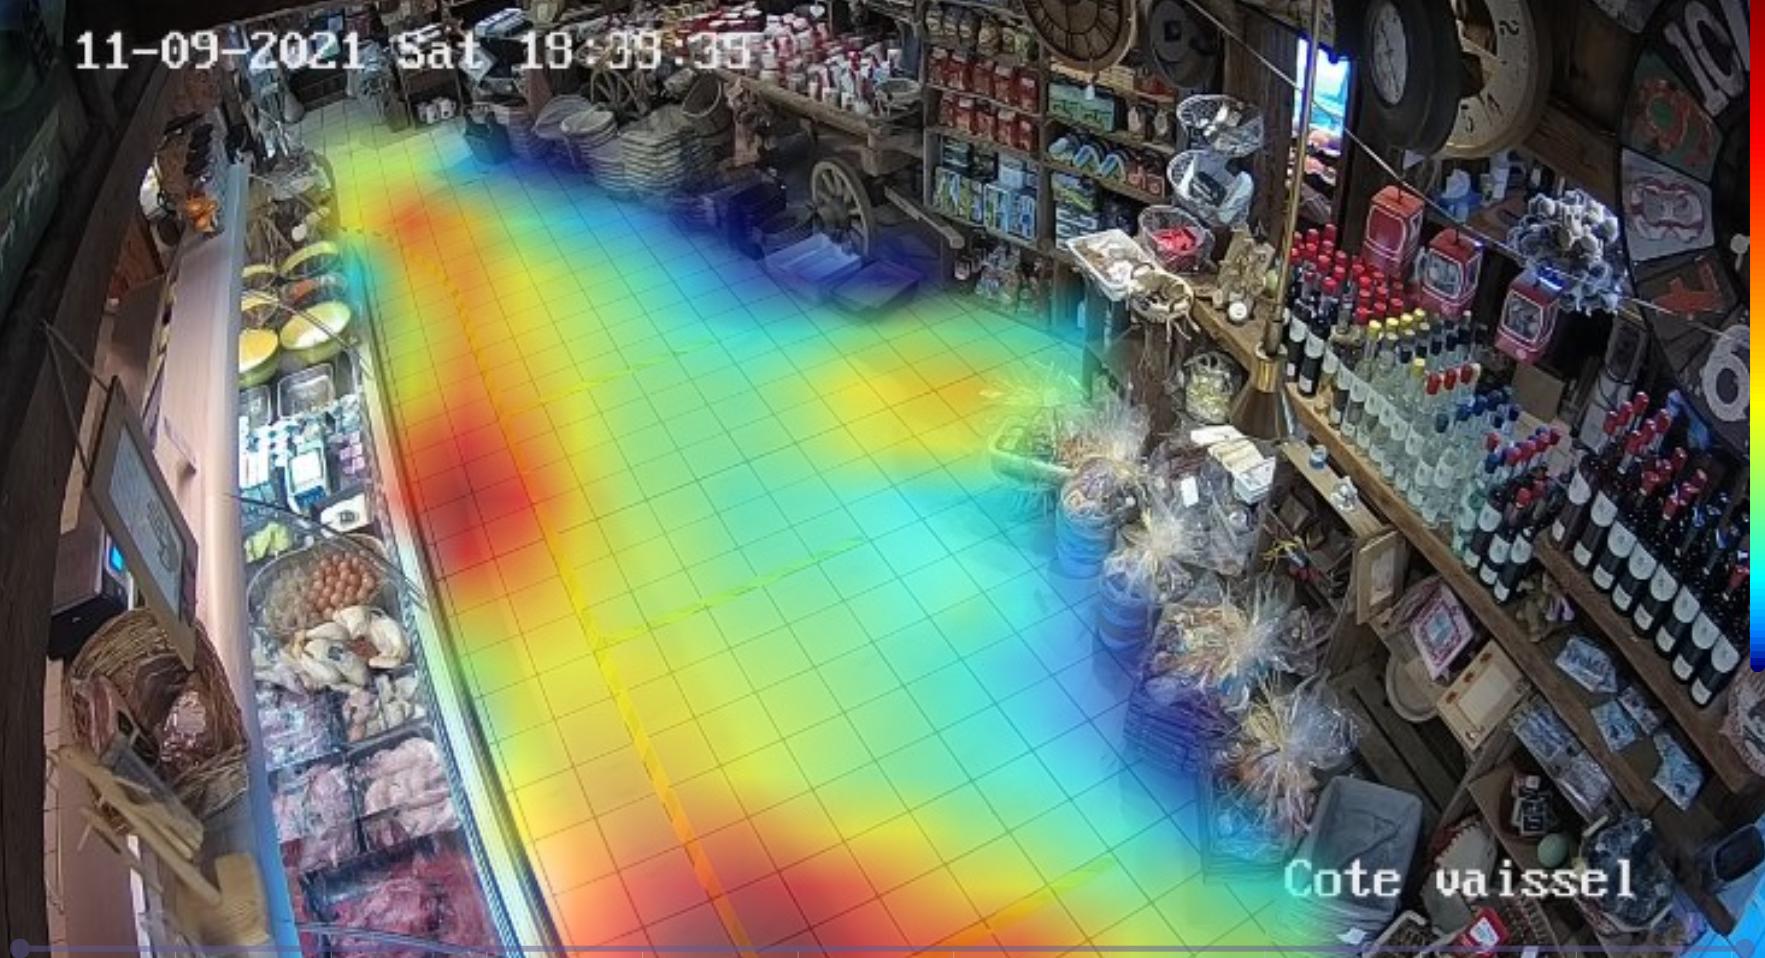
Heatmaps are visual representations of spatial data that show where customers spend the most time in a store. Thanks to artificial intelligence and the cameras already installed in many stores, these maps accurately reveal the busiest areas, the little-visited aisles and the main areas of interest. This potential explains why the global retail video analytics market is growing by more than 20% per year.
Unlike traditional analyses based on sales or checkout receipts, heatmaps capture real in-store activity: they help you understand traffic flows, identify bottlenecks and spot "cold" areas with low engagement, thereby complementing the key performance indicators used to manage shrinkage.
By integrating this technology, retail chains gain a valuable tool to adjust store layouts, test new product placements, or optimize the store's hot spots to maximize their commercial impact.
Concrete applications in large-scale retail, pharmacies and DIY
In supermarkets, for example, heatmaps make it possible to assess how well endcaps are laid out or to check whether promotional products really catch customers' attention. Repositioning based on real traffic flow analysis can generate significant sales increases in the areas concerned.
For pharmacies, where customer journeys are often geared toward specific needs, the analysis helps organize aisles intuitively, by placing closer together the most sought-after products, which are sometimes also the most exposed to theft, and by reducing the time spent looking for an item.
As for DIY chains, these maps reveal areas where customers hesitate and help position information displays or assistants to smooth the customer journey and make purchasing easier.
Loss prevention and optimal allocation of in-store resources
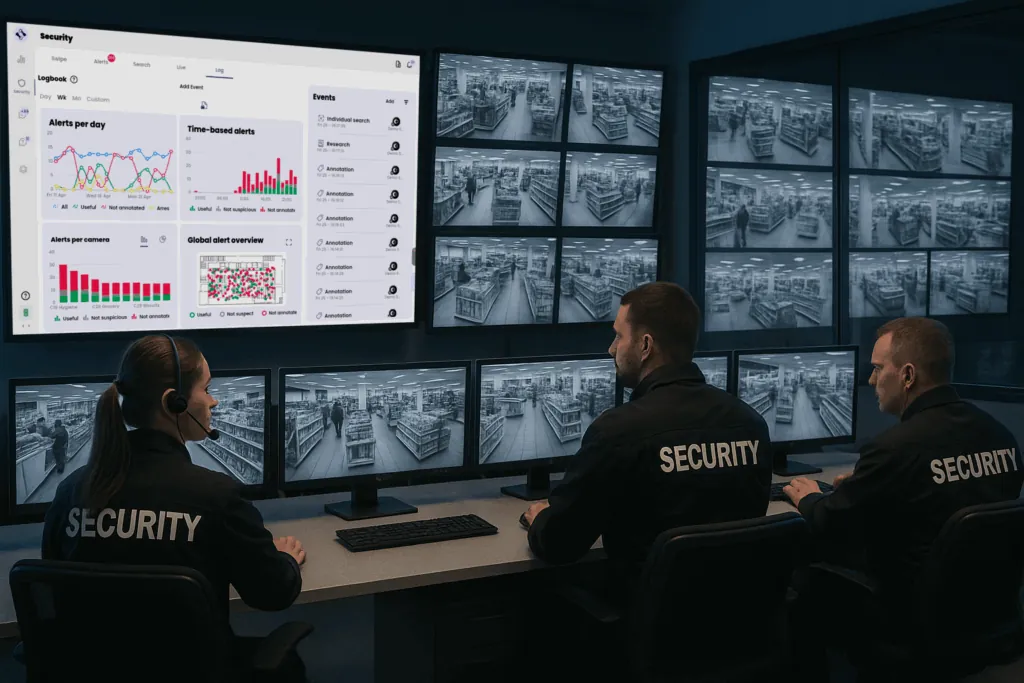
Heatmaps are not only used to improve the customer experience: they are also a loss prevention tool. By identifying areas that are frequently visited but poorly covered, security managers can optimize the positioning of teams or smart sensors. According to the National Retail Federation, shrinkage averages 1.6% of retailers' revenue, a colossal challenge that analytics directly helps to reduce.
By combining footfall data with a map of at-risk zones, retail chains obtain a comprehensive and actionable view. Solutions such as those from Oxania, which integrate people counting and heatmaps within a single platform, make it possible to cross-reference this information to support both protection and the store's commercial performance.
The result: reduced losses, better allocation of human resources, and greater peace of mind for field teams.
A strategic lever for store networks
The adoption of heatmaps is accelerating as retail networks seek to make the most of every square meter. Collaborative initiatives such as those of the ECR Retail Loss Group underline the importance of combining analytics technologies with good field practices to reduce losses sustainably while improving the in-store experience.
The most effective approach often involves deployment through systems integrators specialized in video protection and loss prevention, who are able to adapt the solution to the specific needs of each retail chain. Oxania follows this approach with a platform designed for these integrators, facilitating professional deployment and quick adoption by teams in the field.
At a time when every square meter counts, adopting a heatmap analytics solution is becoming a decisive competitive advantage for any retail chain concerned with its operational efficiency.